Tēnaka Station16-1546
We are proud to present our game-changing innovation.

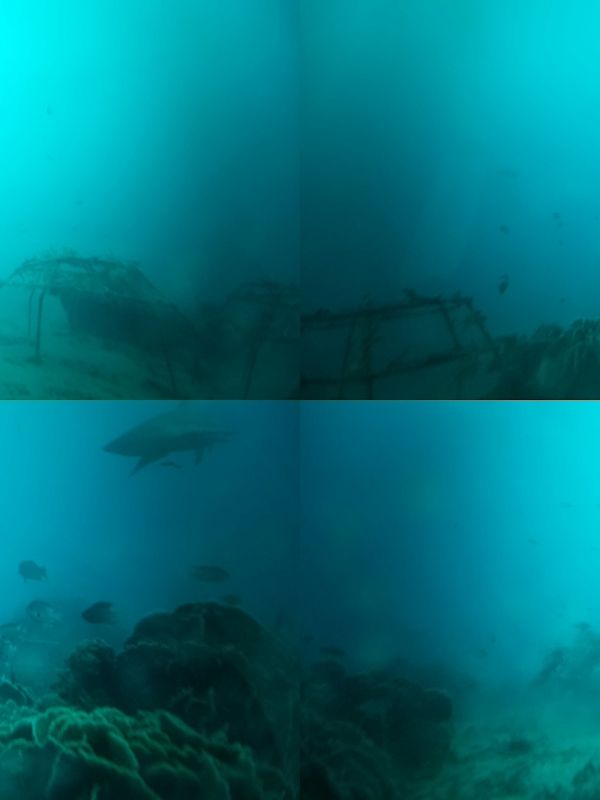
Designed and developed by our coalition of first-class partners led by Orange Business with Microsoft Azure, Netskope, Yucca Lab… and also marine biologist Reef Check Malaysia, Tēnaka Station16-1546 is equipped with underwater camera taking pictures every 30 sec. With up to 6,000 photos a day, the data is analysed by a machine learning algorithm for species recognition and marine biodiversity census.
Data collected will enable a huge leap forward in learning and enhance our impact mesurement.
Delivering the best of science and technology to save corals
Named after the Pantone reference of the colour living coral, Tēnaka Station 16-1546 is a low-tech innovation designed to help marine biologists with live monitoring of the seabeds, marine biodiversity census and predators detection. A world that is still 75-80% unknown, unmapped!
After full-scale test in September 2024, the station has been rolled out in 2025, in three different sites in Malaysia.
The Tēnaka Science® metrics
On both our restored coral reefs and mangrove forests, our field partners collect quantitative data based on international methodologies such as Reef Check for coral reefs.
The data is used on a long term to monitor the growth of the ecosystem, as well as evaluating the impacts on neighboring biodiversity.
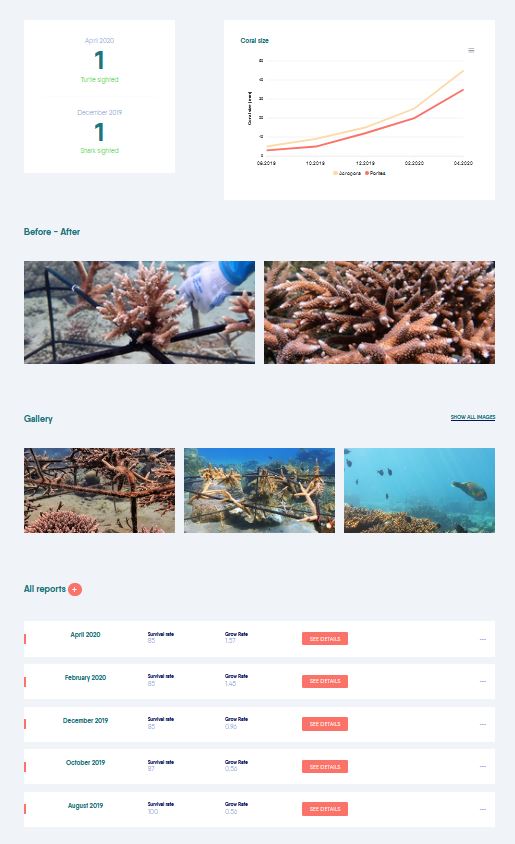
The Tēnaka Science® Platform allows scientists and end users to gather field data in a unified and user-friendly way. The database is alimented on a monthly or quarterly basis, depending on the monitoring programs in place.
Each user can create and manage Impacts Reports through its own organization. Therefore it can be useful for any organization working on marine ecosystems with the need to communicate transparently on its impacts.
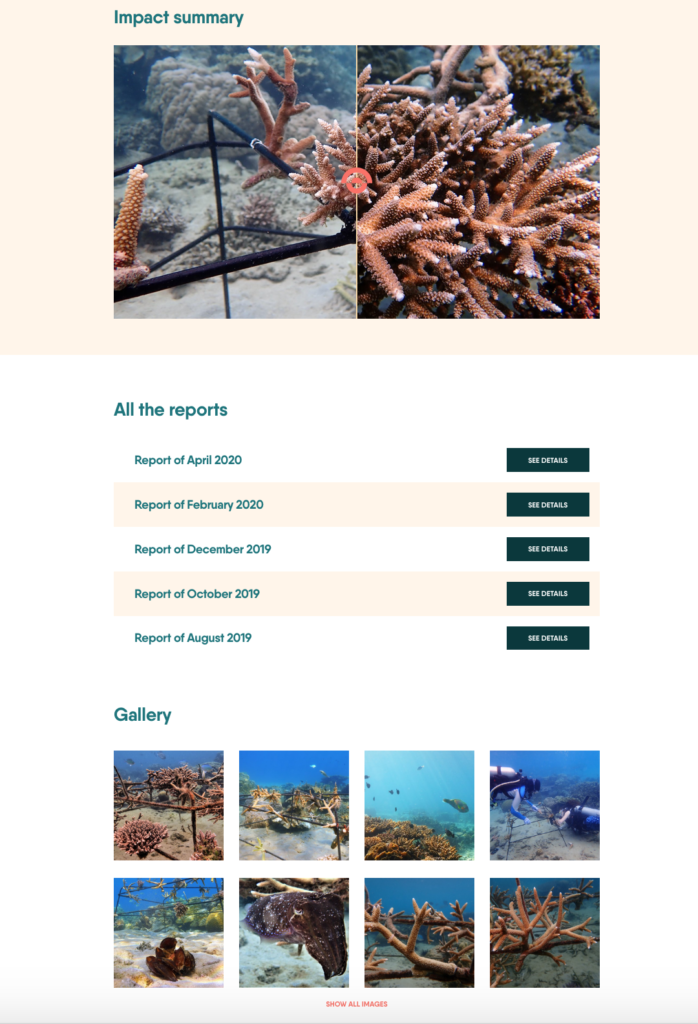
The Tēnaka Science® gallery
An algorithm translates the raw scientific data gathered by scientists into visualized content: reports, charts, key metrics and graphs that are useful for CSR Reporting.
We provide our business partners a unique personal space, for them to communicate in a transparent, pedagogic and user-friendly way to their stakeholders.