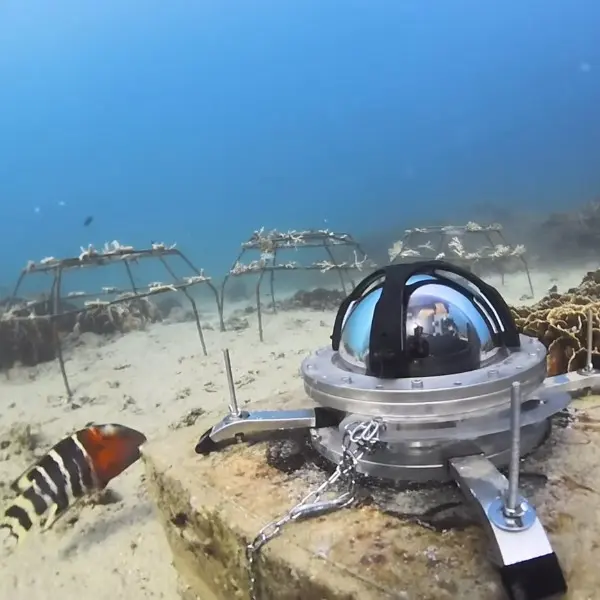
Tēnaka Science
We are proud to present our game-changing innovation.
Station 16-1546
Designed and developed by our coalition of first-class partners led by Orange Business with Microsoft Azure, Netskope, Yucca Lab… and also marine biologist Reef Check Malaysia, Station 16-1546 is equipped with an underwater camera taking pictures every 30 sec. An autonomous solar- powered buoy transfers the images via the 4G cellular network. Taking up to 6,000 photos a day, the data is analysed by a machine learning algorithm for species recognition.
Near-real time data will enable a huge leap forward in learning and enhance our impact mesurement.
The AI algorithm has been open sourced. Public repository here
Tech can help go faster and further
Named after the Pantone reference of the colour living coral, Station 16-1546 is a low-tech innovation designed to help marine biologists with live monitoring of the seabeds, marine biodiversity and predators detection. A world that is still 75-80% unknown.
The first prototype was full-scale tested in Malaysia in September 2024.
A crowdfunding campaign is in progress, so that to be ready from 2025 to deploy to new areas, and new players.
Want to support ? See Donate tab.
The Tēnaka Science® metrics
On both our restored coral reefs and mangrove forests, our field partners collect quantitative data based on international methodologies such as Reef Check for coral reefs.
The data is used on a long term to monitor the growth of the ecosystem, as well as evaluating the impacts on neighboring biodiversity.
The Tēnaka Science® Platform allows scientists and end users to gather field data in a unified and user-friendly way. The database is alimented on a monthly or quarterly basis, depending on the monitoring programs in place.
Each user can create and manage Impacts Reports through its own organization. Therefore it can be useful for any organization working on marine ecosystems with the need to communicate transparently on its impacts.
The Tēnaka Science® gallery
An algorithm translates the raw scientific data gathered by scientists into visualized content: reports, charts, key metrics and graphs that are useful for CSR Reporting.
We provide our business partners a unique personal space, for them to communicate in a transparent, pedagogic and user-friendly way to their stakeholders.