- Ocean
- Science
- Blue Carbon
- development
- ipcc
- ocean
- report
- sustainability
IPCC’s 6th assessment report
IPCC’s 6th assessment report: read Tēnaka’s takeaways on the state of our ocean
IPCC Special Report on the Ocean and Cryosphere in a Changing Climate (SROCC), page 450
Observations : Climate-related trends, impacts, adaptation
The report shows striking and alarming data concerning the ocean :
Ocean temperature : At the ocean surface, temperature has on average increased by 0.88°C from 1850-1900 to 2011-2020, with 0.60°C of this warming having occurred since 1980. (IPCC AR6, 9-5, page 2155)
Ocean salinity : Since 1950 near-surface high salinity regions have become more saline, while low salinity regions have become fresher. (IPCC AR6, 2-76, page 505)
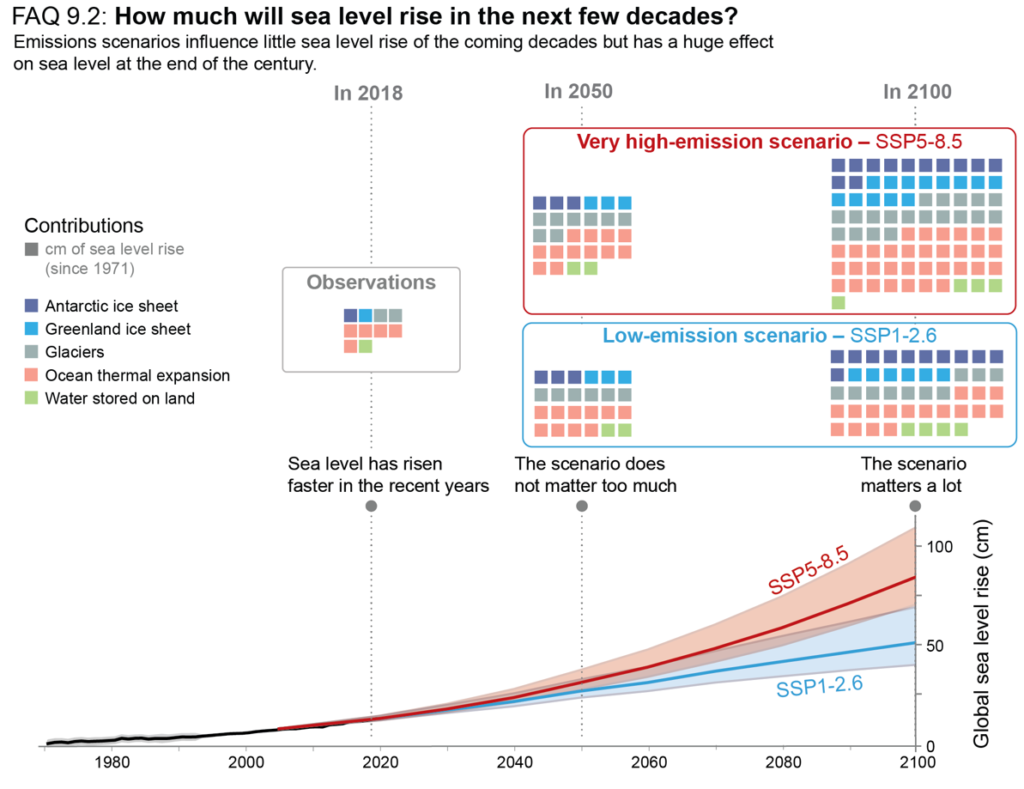
Sea level : Global mean sea level has risen of 0.20m from 1901 to 2018, with an average rate of 2.3mm per year over the period 1971–2018 increasing to 3.7mm per year over the period 2006–2018. (IPCC AR6, 9-9, page 2159)
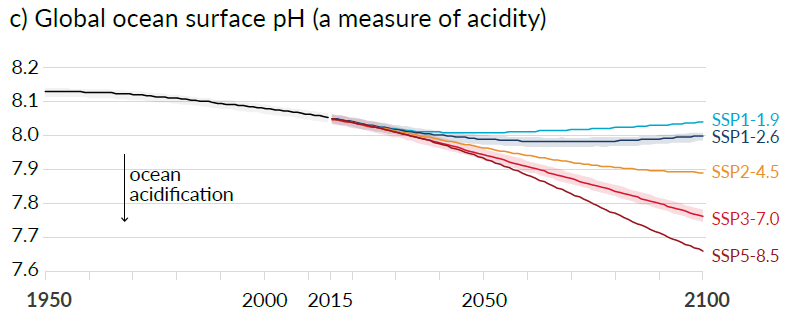
Ocean pH : Surface open ocean pH has declined globally over the last 40 years by 0.003–0.026 pH per decade, and a decline in the ocean interior has been observed in all ocean basins over the past 2–3 decades, leading to an acidification of the ocean. (IPCC AR6, 2-83, page 512)
Ocean deoxygenation : Open-ocean deoxygenation has occurred in most regions of the open ocean during the mid-20th to early 21st centuries, and shows decadal variability. (IPCC AR6, 2-84, page 513)

Projections : scenarios and time horizons
Climate models project significant changes in the ocean state over the coming century. Scientists have imagined two different scenarios : under the high emissions scenario (Representative Concentration Pathway RCP8.5), the impacts by 2090 are substantially larger and more widespread than for the low emissions scenario (RCP2.6).
By 2100 the ocean is very likely to warm by 2 to 4 times as much for low emissions (RCP2.6) and 5 to 7 times as much for the high emissions scenario (RCP8.5) compared with the observed changes since 1970. (SROCC, page 452). It is virtually certain that surface ocean pH will decline, by 0.036–0.042 or 0.287–0.29 pH units by 2081–2100, relative to 2006–2015, for the RCP2.6 or RCP8.5 scenarios, respectively. (SROCC, page 452)
The graph besides is Figure Atlas.15 from the IPCC’s 6th report. It shows the projected changes in sea surface temperature (top), sea level rise (bottom) for 2081–2100 under the low emissions scenario RCP2.6 (left) and high emissions scenario RCP8.5 (right) emission scenarios compared to a 1995–2014 baseline period from the CMIP6 ensemble.
Response options to enhance resilience
The IPCC report shows clear evidence of the impacts of global warming on the ocean and biodiversity. Hence the need to find useful options to mitigate it. This is what Tēnaka and its partners try to do!
Ocean warming, acidification and sea level rise strongly threaten coastal ecosystems. Warming has increased the frequency of large-scale coral bleaching events, and 70–90% of coral reefs are projected to decline at a warming level of 1.5°C, with larger losses at 2°C. (IPCC AR6, Atlas, page 3492)

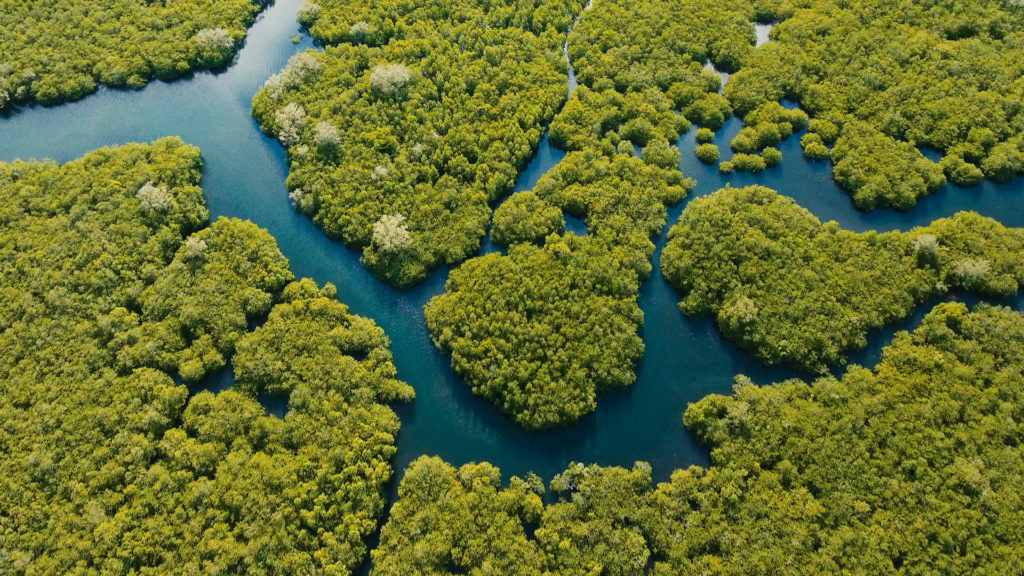
Coastal blue carbon ecosystems, such as mangroves, salt marshes and seagrasses, can help reduce the risks and impacts of climate change, with multiple co-benefits. Some 151 countries around the world contain at least one of these coastal blue carbon ecosystems and 71 countries contain all three. Yet, the potential climatic benefits of blue carbon ecosystems can only be a very modest addition to, and not a replacement for, the very rapid reduction of greenhouse gas emissions. (SROCC, page 454)